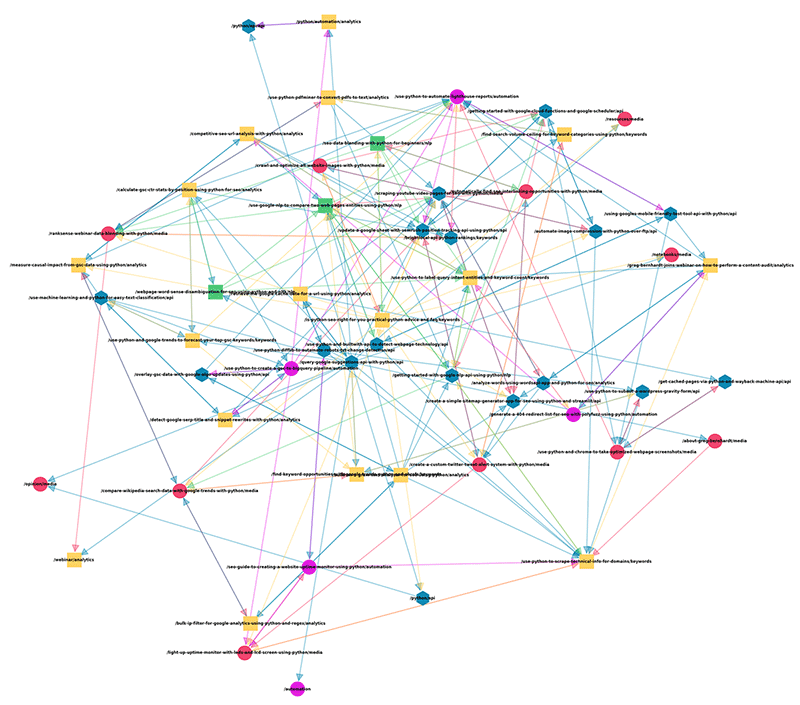
Link graphs are visual representations of relationships between hyperlink entities, aka URLs. The web is one giant network of links, a giant link graph. Luckily, link graphs scale down so not only the entire web is a link graph, but you can scale analysis down to your website or even a part of your website.
Analyzing those relationships between links is known as link analysis and the study, in general, comes from the mathematical topics of network theory and graph theory. If you are math inclined I’d strongly suggest studying in those areas for deep insights and further analysis capabilities.
We know that these relationships between internal links matter a lot for SEO. How you link between pages:
- Communicates structure
- Determines how PageRank is distributed
- Reinforces topicality
- Provides pathways for users
- Communicates importance
Using Python and a powerful module called NetworkX I’m going to show you how easy it is to create a visual topical directed link graph (showing the direction of the link relationship). Afterward, you’ll be able to see and analyze how well different topical categories connect to each other. Note, that one could also do this by many other page attributes. I’ve also tried this with ahrefs UR rating and seeing how different buckets of ratings link between each other.
Important Credit: A significant portion of this code is inspired, extended, or replicated from an excellent tutorial by Justin R Briggs. I implore readers to also check that tutorial out as it goes much deeper into many important information science concepts. As I have learned from Justin, I also hope you learn from my extension and you as well, extend my tutorial.

Table of Contents
Data Prep
Before we get started in creating the link graph we need to generate the data to process. I won’t go into super detail but will describe generally what you’ll need to continue. Note, that visualization does not work well with more than 1000 URLs. It can still be processed programmatically for insights, but the image generated becomes way too much of a mess. You won’t be able to see anything but a mash of lines and nodes. If you have a large site, consider generating a visualization with a section of your site like a blog.
- Internal link data, “source and target“ URLs. You can get this by exporting internal link data from ahrefs, Deepcrawl, or Screamingfrog. Afterward, you’ll want to clean the export sheet to just “source and target“ URLs.
- General crawl data with URL, page title, and meta description.
- Next, using the general crawl data you need to topically categorize. You can skip this step if you already have a very strong topical structure and are able to scrape the category from the page during a crawl. If not, move to step 4.
- Follow this tutorial to categorize your URLs. After that, you should have two spreadsheets. One with your internal link data and one with your link categories. In the spreadsheet with the internal link data, create two new columns that will house the link categories as shown below. You’ll then need to use vlookup to map over the categories for the URLs.
- Lastly, for processing, we need to append the category to the end of the URL into two more columns as shown below. For this use the concatenate formula.
So now you should have a sheet similar to the image below. We are now ready to process the link graph. Yes, I know the steps above can all be done in Python with Pandas, but I am feeling lazy. Go for it using Python if you so desire.

Requirements and Assumptions
- Python 3 is installed and basic Python syntax is understood.
- Access to a Linux installation (I recommend Ubuntu) or Google Colab.
Import Modules
- matplotlib: Visualizes the link graph
- networkx: Processes the link graph data
- numpy: For random graph seeding
- pandas: Processes the spreadsheet
- random: From numpy
- re: Removing the root address for processing and visualization noise reduction
import matplotlib.pyplot as plt
from matplotlib.pyplot import figure
import networkx as nx
from numpy import random as nprand
import pandas as pd
import random
import re
Import Internal Link Data
Now let’s read in the topical link data from the spreadsheet you formulated earlier into a dataframe.
df = pd.read_csv("link-graph.csv")
Next, we pull the source URL data into a list and remove the root URL information so the link graph is less messy visually. We do the same for the target URLs. Then we use the zip() function to create a new list named links that matches up the source links with the corresponding target links.
The list format will look like for each pair [[“/what-is-physics”,”/what-is-motion”]]
source = df['referring-w-cat'].tolist()
source = [x.replace("https://importsem.com","") for x in source]

target = df['link-w-cat'].tolist()
target = [x.replace("https://importsem.com","") for x in target]

links = list(zip(source,target))
Build Graph and Edge List
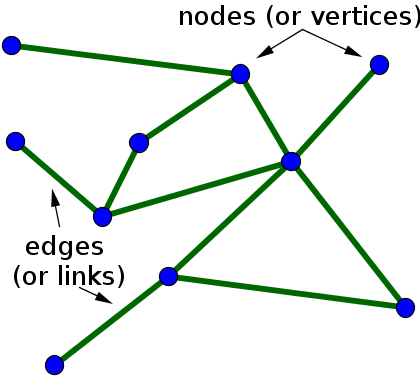
Next, we build the edge list for each category. In graph theory edges are the connections between nodes. Nodes are the graph’s entities. In our case, the nodes are the URLs and the edges are the representation of their connection via a hyperlink.

Below for each category you have, we do some list comprehension where we zip() the source and target lists where the same category is at the end of the URL of the source link. That is our category identifier.
api_links = [x for x in zip(source, target) if "/api" in x[0]]
media_links = [x for x in zip(source, target) if "/media" in x[0]]
analytics_links = [x for x in zip(source, target) if "/analytics" in x[0]]
automation_links = [x for x in zip(source, target) if "/automation" in x[0]]
keywords_links = [x for x in zip(source, target) if "/keywords" in x[0]]
nlp_links = [x for x in zip(source, target) if "/nlp" in x[0]]
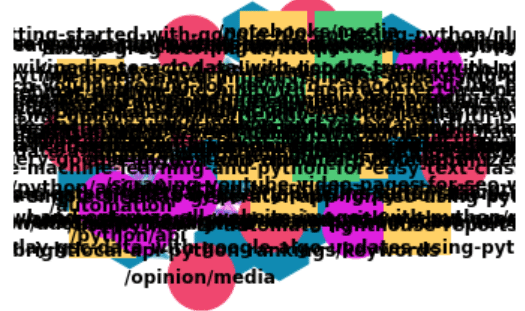
Next, we start working on the link graph construction. Each run the graph is processed the same but the visual output can change. To preserve the visual state from run to run we can set a seed for the link graph to be generated from. If you start seeing visual issues like the graph is mashed up like the below example, change the seed number and it should render fine. After that, we push our links list which contains the complete source and target link list.

seed = 6
nprand.seed(seed)
random.seed(seed)

G = nx.DiGraph(links)
Build Node List
In this next part, we’ll loop through our link nodes within the NetworkX object G that we fed with our link data and assign an attribute of “page_type” to each depending on their category. This will be used for coloring the nodes when they are drawn in a little bit.
for node_id in G.nodes:
    if "api" in node_id:
        G.nodes[node_id]["page_type"] = "api"
    elif "media" in node_id:
        G.nodes[node_id]["page_type"] = "media"
    elif "analytics" in node_id:
        G.nodes[node_id]["page_type"] = "analytics"
    elif "automation" in node_id:
        G.nodes[node_id]["page_type"] = "automation"
    elif "keywords" in node_id:
        G.nodes[node_id]["page_type"] = "keywords"
    elif "nlp" in node_id:
        G.nodes[node_id]["page_type"] = "nlp"
    else:
      pass
Now we create lists for bundling the categorical nodes for coloring later on. With list comprehension, we loop through the nodes in the G object and filter in those that meet our categorical demands.
api = [v for v in G.nodes if G.nodes[v]["page_type"] == "api"]
media = [v for v in G.nodes if G.nodes[v]["page_type"] == "media"]
analytics = [v for v in G.nodes if G.nodes[v]["page_type"] == "analytics"]
automation = [v for v in G.nodes if G.nodes[v]["page_type"] == "automation"]
keywords = [v for v in G.nodes if G.nodes[v]["page_type"] == "keywords"]
nlp = [v for v in G.nodes if G.nodes[v]["page_type"] == "nlp"]
Build Graph Layout and Draw
Time to choose the layout for the graph. There are about a dozen to choose from depending on your goal. We’ll be using the spring layout. k is equal to the distance between nodes. Defines how spread out or compact the graph image ends up.
pos = nx.spring_layout(G, k=0.9)
Now we start drawing the graph. We’ll start with the edges by using the function nx.draw_networkx_edges(). Edges are the lines connecting the nodes showing a link relationship. We feed in the whole link graph object, the layout, and then assign a color arrow (directed link graph), visual node size, and which category (edgelist) this should apply to. We do this for each category.
nx.draw_networkx_edges(G, pos, width=3, alpha=0.4,
                       edge_color="#118AB2", arrowsize=50, node_size=2000, edgelist=api_links)
nx.draw_networkx_edges(G, pos, width=3, alpha=0.4,
                       edge_color="#EF476F", arrowsize=50, node_size=2000, edgelist=media_links)
nx.draw_networkx_edges(G, pos, width=3, alpha=0.4,
                       edge_color="#118AB2", arrowsize=50, node_size=2000, edgelist=analytics_links)
nx.draw_networkx_edges(G, pos, width=3, alpha=0.4,
                       edge_color="#DF21DE", arrowsize=50, node_size=2000, edgelist=automation_links)
nx.draw_networkx_edges(G, pos, width=3, alpha=0.4,
                       edge_color="#FFD166", arrowsize=50, node_size=2000, edgelist=keywords_links)
nx.draw_networkx_edges(G, pos, width=3, alpha=0.4,
                       edge_color="#50C878", arrowsize=50, node_size=2000, edgelist=nlp_links)
Next, we draw the nodes and use a similar function called nx.draw_networkx_nodes(). Again, we feed the link graph, the layout, the categorical nodelist, size, and color. A different parameter is node_shape. Some of the shapes you can use are: h for hexagon, o for circle, d for diamond, and s for square. These shapes are defined by matplotlib.scatter markers.
nx.draw_networkx_nodes(G, pos, nodelist=api,
                       node_color="#118AB2", node_shape="h", node_size=2000)
nx.draw_networkx_nodes(G, pos, nodelist=media,
                       node_color="#EF476F", node_size=2000)
nx.draw_networkx_nodes(G, pos, nodelist=analytics,
                       node_color="#FFD166", node_shape="s", node_size=2000)
nx.draw_networkx_nodes(G, pos, nodelist=automation,
                       node_color="#DF21DE", node_size=2000)
nx.draw_networkx_nodes(G, pos, nodelist=keywords,
                       node_color="#FFD166", node_shape="s", node_size=2000)
nx.draw_networkx_nodes(G, pos, nodelist=nlp,
                       node_color="#50C878", node_shape="s", node_size=2000)
Draw Labels and Display Link Graph
Lastly, we can define the labels for the nodes which will be the URLs. It would be great if you could figure out how to remove the category suffix from each URL. I was unable to find a solution as list comprehension doesn’t work with tuple objects. Again we feed in the graph object, and layout, and then set font size and weight. Adjust for readability.
NetworkX uses matplotlib and so we draw the graph as we normally do with matplotlib graphs. Setting small margins, and turning off the axis labels and facecolor to white helps with readability. Feel free to adjust the figsize depending on your graph size. You might also want to consider using plt.tight_layout() to adjust padding. Finally, we display with plt.show().
nx.draw_networkx_labels(G, pos, font_size=12, font_weight="bold")

plt.gca().margins(0.1, 0.1)
plt.axis("off")
plt.rcParams['figure.figsize'] = [50, 50]
plt.rcParams['figure.facecolor'] = 'white'
plt.show()
Output

Conclusion
So now we’re faced with a big “so what” It’s pretty, but what can I learn from it to help with your SEO? Visually you are able to gut check topical cluster density, connectedness, and total coverage with some amount of understanding of individual connectedness. However, one of the big advantages of doing this is not in the visual, but the additional functions available to you via NetworkX functions. Some of the useful ones are as follows:
- nx.density(G): ratio of edges to nodes, a measure of connectedness
- nx.diameter(G): distance between furthest two nodes
- nx.transitivity(G): probability for clusters to form
- nx.average_clustering(G): Measure of tightness of node
Important Credit: As I mentioned in the intro, a significant portion of this code is inspired, extended, or replicated from an excellent tutorial by Justin R Briggs.
Remember to try and make Justin’s code with my additions even more efficient and extend it in ways we never thought of! I would love to see methods for creating a cleaner visual, especially chopping off the categories from the URLs. I couldn’t figure this out because the NetworkX object turns the data into tuples and list comprehension doesn’t work. Now get out there and try it out! Follow me on Twitter and let me know your SEO applications and ideas for link graph building!
NetworkX FAQ
- Build a Custom Named Entity Visualizer with Google NLP - June 19, 2024
- Storing CrUX CWV Data for URLs Using Python for SEOs - January 20, 2024
- Scraping YouTube Video Page Metadata with Python for SEO - January 4, 2024


