Storing CrUX CWV Data for URLs Using Python for SEOs
The CWV panic days appear to be over, but keeping tabs on the data is still useful. CrUX data is useful for SEOs because it offers performance analysis opportunities for real-user Core Web Vitals metrics like Largest Contentful Paint (LCP), First Input Delay (FID), and Cumulative Layout Shift (CLS), which are minor ranking factors. By analyzing CrUX data, websites can optimize the user experience and potentially gain minor improvements in search rankings.
This is especially important for e-commerce sites where shoppers expect a flawless experience. See the Deloitte report from several years ago called “Milliseconds Make Millions“.
In this short Python SEO tutorial, I’ll show you step-by-step how to use the CrUX API and Python to generate URL metrics for LCP, FID, and CLS, plus a holistic pass/fail label.
Table of Contents
What is CrUX data?
Google’s Chrome User Experience Report, commonly known as CrUX, is a public dataset of real user performance data for millions of websites across the web. This dataset is gathered from users who have opted into syncing their browsing history, have not set up a Sync passphrase, and have usage statistics reporting enabled.
Requirements and Assumptions
- Python 3 is installed and you understand basic Python syntax
- Access to a Linux installation (I recommend Ubuntu) or Google Colab
- CrUX API key
- CSV file with your site URLs
- Be careful copying the code; indents are not always preserved
Get your API Key
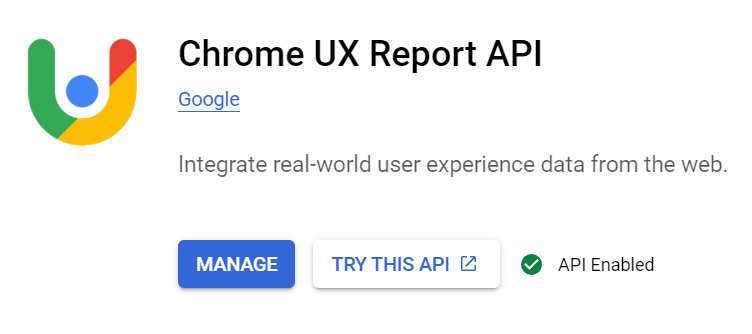
Getting an API key for the CrUX API is very easy. Unlike some Google APIs, it is a simple API key rather than OAuth or service-account credentials. Head over to the Google Cloud Console CrUX API page. This assumes you have a Google Cloud account. You’ll see a blue “Enable” button.
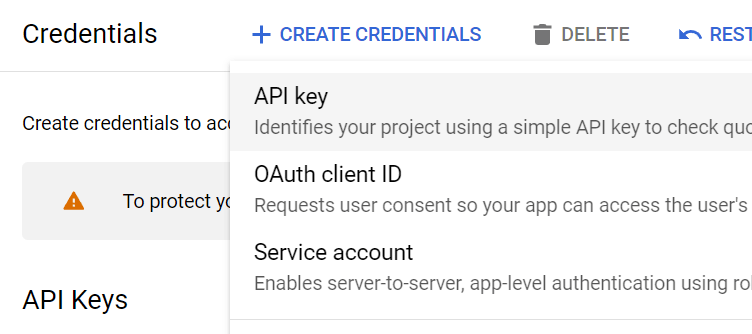
Simply click that and then head over to the credentials page and hit the “Create Credentials” link at the top and select API key. This will generate the key. Record it for later.
Importing Libraries
The CrUX CWV script imports a few Python libraries essential for its operation:
import pandas as pd
import requests
import json
- requests: for calling APIs
- pandas: storing the result data
- json: handling the response from the APIs
Preparing the DataFrame
First, we need to import our list of domain URLs. If you don’t have a CSV and only want to process a small number, you can create a manual DataFrame like this
df = pd.DataFrame({'url': ['https://towardsdatascience.com/', 'https://www.physicsforums.com/', 'https://searchengineland.com/','https://www.searchenginejournal.com/']})
After loading the data into a DataFrame, we’ll enter the API key we created earlier and set up some necessary storage variables.
df = pd.read_csv("")
API_KEY = ""
headers = {"Content-Type": "application/json"}
lcp = []
fid = []
cls = []
vitals = []
Making the API Requests
For each URL in the DataFrame, we construct a data payload and make a POST request to the CrUX API endpoint:
for index, row in df.iterrows():
  data = {"origin": row["url"], "formFactor": "PHONE", ...}
  response = requests.post(f"https://chromeuxreport.googleapis.com/v1/records:queryRecord?key={API_KEY}", headers=headers, json=data)
Handling Responses and Errors
We use try-except blocks to handle responses and errors so the script continues processing rather than stopping on an error.
try:
  response = requests.post(f"https://chromeuxreport.googleapis.com/v1/records:queryRecord?key={API_KEY}", headers=headers, json=data)
  response.raise_for_status()
Process the Response
The CrUX API response is JSON and looks like this:
{'cumulative_layout_shift': {'histogram': [{'start': '0.00',
    'end': '0.10',
    'density': 0.9408612440191391},
   {'start': '0.10', 'end': '0.25', 'density': 0.04363636363636365},
   {'start': '0.25', 'density': 0.015502392344497611}],
  'percentiles': {'p75': '0.03'}},
 'first_input_delay': {'histogram': [{'start': 0,
    'end': 100,
    'density': 0.8599109714585013},
   {'start': 100, 'end': 300, 'density': 0.09374181722964173},
   {'start': 300, 'density': 0.04634721131186221}],
  'percentiles': {'p75': 35}},
 'largest_contentful_paint': {'histogram': [{'start': 0,
    'end': 2500,
    'density': 0.802775679758303},
   {'start': 2500, 'end': 4000, 'density': 0.11735271903323187},
   {'start': 4000, 'density': 0.07987160120845892}],
  'percentiles': {'p75': 2228}}}
The code below will parse the JSON response and extract the 75th-percentile (p75) metrics for each URL. Using p75 is useful because page-view counts vary across URLs; it provides a more balanced comparison regardless of traffic volume.
After we parse the percentiles, we add them to the storage variables created at the beginning. We then apply Google’s thresholds for pass/fail on each metric and store the result. If a URL isn’t found or another issue occurs, we store n/a for those fields.
try:
  response_JSON = response.json()['record']['metrics']
  p75_lcp = float(response_JSON['largest_contentful_paint']['percentiles']['p75'])
  p75_fid = float(response_JSON['first_input_delay']['percentiles']['p75'])
  p75_cls = float(response_JSON['cumulative_layout_shift']['percentiles']['p75'])

  lcp.append(p75_lcp)
  fid.append(p75_fid)
  cls.append(p75_cls)

  if p75_lcp < 2500 and p75_fid < 100 and p75_cls < 0.1:
    vitals.append("pass")
  else:
    vitals.append("fail")
except KeyError:
  vitals.append("n/a")
  lcp.append("n/a")
  fid.append("n/a")
  cls.append("n/a")
Process Errors
If the script fails to connect to the CrUX API, we’ll store “error” for those fields in the DataFrame.
except RequestException as e:
  vitals.append("error")
  lcp.append("error")
  fid.append("error")
  cls.append("error")
Record Successful CWV Data
We’ll move the data from the storage variables into the DataFrame and then export it to CSV for analysis in Google Sheets.
df["lcp"] = lcp
df["fid"] = fid
df["cls"] = cls
df["cwv"] = vitals

df.to_csv('cwv-url-data.csv')
Output
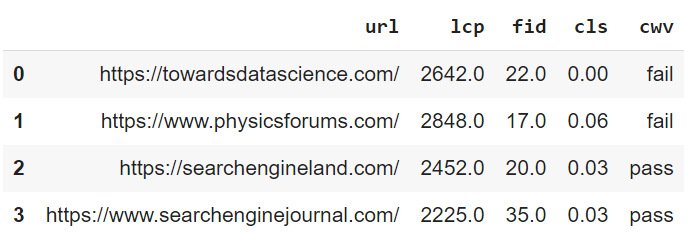
Conclusion
Now you have a framework for analyzing your CWV metrics with the CrUX API. Try making the code more efficient and extending it in ways I haven’t considered. I can think of a few ways we can extend this script:
- Run daily, store in BigQuery, and create a dashboard to show time series changes in data
- Blend in funnel or traffic data to create correlations between speed and performance
- Use to compare your properties against competitors
Now get out there and try it out! Follow me on Twitter and share your Python SEO applications and ideas!
CrUX and CWV FAQ
What are Core Web Vitals?
Core Web Vitals are metrics defined by Google that reflect a website’s user experience. They include metrics like Largest Contentful Paint (LCP), First Input Delay (FID), and Cumulative Layout Shift (CLS), which assess a page’s loading performance, interactivity, and visual stability.
How Do Core Web Vitals Affect SEO?
Core Web Vitals impact SEO because they are ranking factors in Google’s search algorithm. Better performance in these metrics can lead to higher search engine rankings due to their influence on user experience.
What is CrUX Data?
The Chrome User Experience Report (CrUX) is a public dataset from Google that includes real user performance data for millions of websites. This data reflects the real-world experience of users on these websites, particularly in terms of Core Web Vitals.
Why is CrUX Data Important for Website Owners?
CrUX data is invaluable for website owners because it offers insights into their site’s performance based on actual user interactions. This information helps identify areas for improvement in speed, responsiveness, and stability.
How Can I Access and Use CrUX Data?
CrUX data is accessible through Google BigQuery, the Chrome UX Report API, and various third-party tools. Website owners use this data to analyze their site’s performance, benchmark against industry standards, and optimize based on data-driven insights.
Can CrUX Data Be Used to Improve Mobile Experience?
Absolutely. CrUX data includes metrics from both desktop and mobile users, making it a key resource for optimizing mobile user experiences, especially important for Google’s mobile-first indexing.
Are There Any Costs Associated with Accessing CrUX Data?
While Google BigQuery access to CrUX data might incur costs beyond its free tier, the Chrome UX Report API and some third-party tools offer free access to CrUX data.
How Often is CrUX Data Updated?
CrUX data is updated monthly, providing a timely perspective on website performance and user experience, enabling continuous monitoring and optimization.
This FAQ was written with help using AI

- Evaluate Subreddit Posts in Bulk Using GPT4 Prompting - December 12, 2024
- Calculate Similarity Between Article Elements Using spaCy - November 13, 2024
- Audit URLs for SEO Using ahrefs Backlink API Data - November 11, 2024