Compare Wikipedia Search Data with Google Trends with Python
There are countless ways to understand trends which are important in understanding the past, present, and future. I’m sure everyone is familiar with Google Trends. No doubt it’s very powerful, but there are options as well. One being Wikipedia. Wikipedia currently is the 4th most visit website in the US.
If only there were a way to understand pageview trends perhaps we could use that in our data analysis for trends and predictions. Fortunately, there is! In fact, MediaWiki which Wikipedia runs on has an expansive API offering that SEO’s should be taking more advantage of. It is not unreasonable to extrapolate Wikipedia data to the greater industry. Let’s dive in!
Not interested in the tutorial? Head straight for the app here.
Table of Contents
Requirements and Assumptions
- Python 3 is installed and basic Python syntax understood
- Access to a Linux installation (I recommend Ubuntu) or Google Colab.
Import and Install Modules
- pandas: for storing and exporting results
- requests: for making API calls to Wikipedia
- json: for processing Semrush API response
- pytrends: to interface with the Google Trends API
First, let’s install the PyTrends module which you won’t like have already. If you are using Google Colab put an exclamation mark at the beginning.
pip3 install pytrends
Now we can import the needed modules at the top of our script.
import pandas as pd
import requests
import json
from pytrends.request import TrendReq
Hit Wiki API
Let’s now set up our API call to Wikipedia (MediaWiki). First, we’ll want to create a variable for our keyword or keyword phrase. This is what you’re looking for data on. In this tutorial’s example, we’re going to use “Olympic Games”. The API for Wikipedia is actually quite extensive and I encourage you to explore it. I know I have a few more tutorials in mind using other API parameters. Let me break down this API call we’re using:
- https://en.wikipedia.org/w/api.php: Is the API endpoint
- action: Which action to perform, there are dozens available here
- prop: Which properties to get for the queried pages
- titles: What the query is.
- format: How you want the response. There are several options. Even HTML for debugging purposes.
After we build the API call we request it and load the JSON response into a JSON Python object to parse in the next bit.
keyword="Olympic Games"
url = f'https://en.wikipedia.org/w/api.php?action=query&prop=pageviews&titles={keyword}&format=json'

payload={}
headers = {}

response = requests.request("GET", url, headers=headers, data=payload)
getjson = json.loads(response.text)
To graph the results we need to store the data in a Pandas dataframe. We first create an empty dataframe with two columns, Date and Hits.
df = pd.DataFrame(columns = ['Date', 'Hits'])
Process Wiki JSON response
Using the JSON API response we can parse through the data and append the date and pageviews to the dataframe we created above. To see what the response looks like visually you can go to this page: https://en.wikipedia.org/w/api.php?action=query&prop=pageviews&titles=Olympic_Games in your browser.
for k,item in getjson['query']['pages'].items():
  for j,value in item['pageviews'].items():
    data = {'Date': j, 'Hits': value}
    df = df.append(data, ignore_index=True)
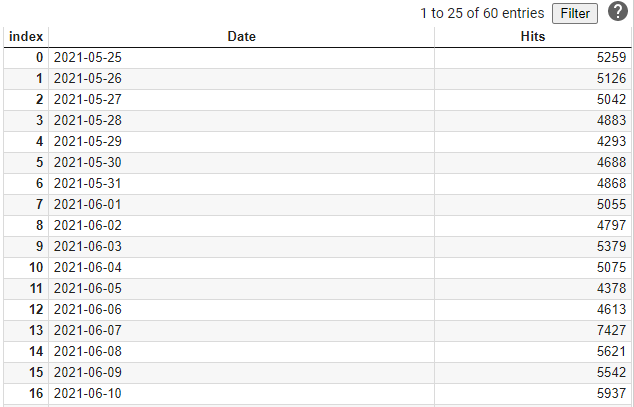
The dataframe will look something like this:

Plot Wiki Data
All that is left is to plot the data using a line chart. The one-line code below is all that is needed.
df.plot.line(x='Date',y='Hits',ylabel='Views',figsize=(10,5),title='Wiki PageView Trend for ' + keyword)

Request Google Trends API
Next, it’s time to use Pytrends module to query Google Trends. We run the TrendReq() function while sending the attributes for language, country, and timezone offset and store that result in a variable. Then we build the keyword list. We can include up to 5 keywords, but for this tutorial, we just want to reuse what we sent Wikipedia. Then send the keyword list to the function, build_payload() which does the heavy lifting along with setting the timeframe, the Google Trends category, location, and google property (images, news, search…). All those options are well documented here. We then send that data to the interest_over_time() function and store it in a dataframe. Done!
pytrends = TrendReq(hl='en-US', tz=360)
kw_list = [keyword]
pytrends.build_payload(kw_list, cat=0, timeframe='today 12-m', geo='', gprop='')
df2 = pytrends.interest_over_time()
Plot Google Trends Data
Once we have our Google Trends data in a dataframe, you guessed it, we can plot it. Nealy the same code as for Wiki
df2.plot.line(ylabel='Views',figsize=(10,5),title='Google Trend for ' + keyword)

As you can see both Wiki and Google Trends match up pretty well!
Conclusion
So there you have it! How easy was that!? Keep this in your toolbox as another option when trying to understand what things are trending in the world and where. Get ahead of the curve! With this framework, you can extend it in so many interesting directions. Remember to try and make my code even more efficient. I’d love to see some functions used! Now get out there and try it out! Follow me on Twitter and let me know your applications and ideas!
Be sure to check out the app for this tutorial and see my other apps available.
Python Google Trends FAQ
- Evaluate Subreddit Posts in Bulk Using GPT4 Prompting - December 12, 2024
- Calculate Similarity Between Article Elements Using spaCy - November 13, 2024
- Audit URLs for SEO Using ahrefs Backlink API Data - November 11, 2024


