SEO Data Blending with Python for Beginners
Data is everything for an SEO and it’s all too often scattered across proprietary platforms that do a good job of visualizing and analyzing that data according to how they think you want. Even when these platforms give you export methods you still need to load it into Excel and Google Sheets and perform some magic. That can all take time, still has limitations, and is not easy to quickly replicate across clients.
This tutorial will show you how to blend or stitch data across several common SEO platforms including Google Search Console, Google Analytics, Screaming Frog, and ahrefs. I want to get across that although I think blending these platforms is useful, it’s not nearly the end-all of possibility. I’m using these platforms to show the process so you can go and try with other platforms and extend the analysis to fit your needs. Just make sure the data from all sources share a unique key. 9/10 this will be a URL or keyword. If you have that, you can blend anything together. In this tutorial, the key will be the URL.
This tutorial is based on the RankSense Twittorial I did with Hamlet Batista. If you want to watch the video instead you can watch it here. I have also since that time made this into a Streamlit app you can use and the link will be at the end of this tutorial. Note that any data outside of English will break because the data I use below and in the app is in English. You can get around that with some quick translations.
Table of Contents
Requirements and Assumptions
- Python 3 is installed and basic Python syntax understood
- Access to a Linux installation (I recommend Ubuntu) or Google Colab
- Screaming Frog
- ahrefs account
- Google Search Console
- Google Analytics
Data Exports
Let’s first export the data we’ll be blending
- Export Performance data (60 days clicks, impressions, CTR, position) in Google Search Console. What is downloaded is a zip file. Open it and what we want is page.csv, rename to gsc.csv
- Export Google Analytics Landing Page Data (60 days, 1000 items) Save as analytics.xlsx
- Export Ahrefs Top Pages Data (Full, UTF-8) Save as ahrefs.csv
- Export Screaming Frog Crawl. HTML only. Save as sf.csv
Install Modules
Before we begin, remember to watch the indents of anything you copy here as sometimes the code snippets don’t copy perfectly. All of the modules below should be in core Python 3 besides Pandas (if using Google Colab, put an exclamation mark at the beginning):
pip3 install pandas
Let’s import pandas and set our domain URL variable for later usage.
import pandas as pd

domain = "YOUR-FULL-DOMAIN-URL"
Import Data Sources
Now we import the first data set which will be Google Search Console into a pandas dataframe. I like to remove the percentage sign from the CTR data so we can round it later.
df_gsc = pd.read_csv("gsc.csv")
df_gsc["CTR"] = df_gsc["CTR"].replace({'%':''}, regex=True).astype(float)
Next, we import the ahrefs data into a separate dataframe. We will only be grabbing the columns “# of Keywords” and “URL”. The rest is tossed aside. Here I also like to rename the default ahrefs column title for easier reading.
df_ahrefs = pd.read_csv("ahrefs.csv")[["# of Keywords","URL"]]
df_ahrefs.rename(columns={"# of Keywords": "Keywords"}, inplace = True)
Next, we import the Google Analytics data and only select “Land Page”, “Session”, “New Users” and “Bounce Rate” data. If you look at the Google Analytics data you’ll notice that the “Landing Page” URLs are just paths. This will cause a problem because the other data sources have the full URL which means the keys won’t match and won’t blend. We need to append the domain variable we set earlier to the “Landing Page” path to complete the URL. Additionally, I like to round the bounce rate for easier reading.
df_ga = pd.read_excel('ga.xlsx','Dataset1')[["Landing Page","Sessions","New Users","Bounce Rate"]]
df_ga['Landing Page'] = domain + df_ga['Landing Page'].astype(str)
df_ga["Bounce Rate"] = round(df_ga["Bounce Rate"] * 100).astype(int)
Our last data to import in is the Screaming Frog crawl data. Here we only select “Title 1”, “Word Count” and “Crawl Depth”. With any of these imports feel free to choose the columns you are interested in. Also, I like to rename “Title 1” to “Title” for easier reading.
df_sf = pd.read_csv('sf.csv')[["Address","Title 1", "Word Count","Crawl Depth"]]
df_sf.rename(columns={"Title 1": "Title"}, inplace = True)
Merge Dataframes
Now is the time for the magic to begin and it’s so ridiculously easy, it only takes 1 line. We use the Pandas merge function which merged two dataframes together. You can think of Pandas merge function as a SQL join where the result is the new dataframe. The first two parameters are the names of the two data sources you are merging. The left_on and right_on refer to those two data sources in order and signals how the merge function matches data. In the case below we’re merging based on the “Page” and “Landing Page” columns. The last parameter is very much like SQL join options. You can have inner, outer, left, right, cross. Inner will include only data that has a match. For the merge below we start with Google Search Console and Google Analytics.
df_gsc_ga = pd.merge(df_gsc, df_ga, left_on='Page', right_on='Landing Page', how='inner')
Now that we have our first merged dataframe with GSC and GA, we’re going to take that combined dataframe and merge in another which is Screaming Frog.
df_gsc_ga_sf = pd.merge(df_gsc_ga, df_sf, left_on='Page', right_on='Address', how='inner')
We now have a dataframe with 3 data sources in it, and it’s time for the fourth which is ahrefs.
df_final = pd.merge(df_gsc_ga_sf, df_ahrefs, left_on='Page', right_on='URL', how='inner')
Manipulate Dataframe
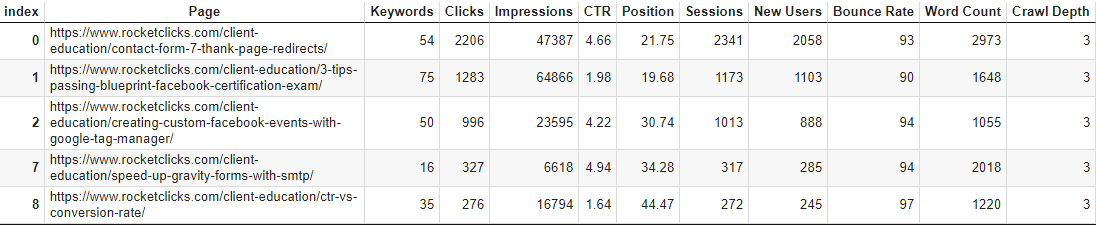
We’ve done it! We have successfully merged all 4 data sources! Now you could be done or you could want to work with it a little bit more to get exactly what you want. In my case below I am filtering for rows that have “education” in the Page URL and have a word could of greater than 1000. Then I sort by the Clicks column descending. Then a little pandas comprehension to sort the columns for better readability and lastly we drop some redundant columns due to the merge.
df_final = df_final[df_final['Page'].str.contains('education') & (df_final['Word Count'] > 1000)]
df_final.sort_values(by=['Clicks'], ascending=False)
df_final = df_final[ ['Page'] + ['Keywords'] + [col for col in df_final.columns if col != 'Page' and col != 'Keywords' ]]
df_final.drop(['Landing Page', 'Address','URL','Title'], axis=1, inplace=True)
df_final.head()
Optional Plot and Export
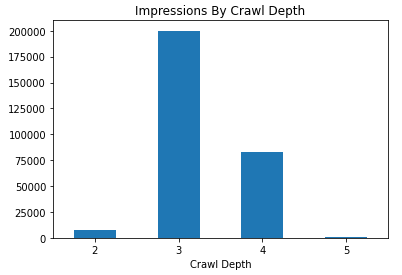
You could stop there, or go even further and plot some graphs. Below I create a simple bar graph that compares crawl depth with a summed number of impressions. Maybe there is an insight in there!
df_final.groupby(['Crawl Depth'])['Impressions'].sum().plot.bar(y='Impressions', x='Crawl Depth', title="Impressions By Crawl Depth", rot=0)
Lastly, once your data is ready you can export it to CSV and do whatever you think is next, like further work in Google Sheets.
df_final.to_csv("Ahrefs-GSC-GA-SF-DataBlend.csv")
Conclusion
Break your data out from your platforms and blend them together to find interesting insights. You now have the process to do this and extend into your wildest imaginations. So get out there and try it out! Follow me on Twitter and let me know your applications and ideas! Don’t forget to check out the SEO Data Blending Streamlit app I made from this tutorial.
Python Data Blending FAQ
What is data blending in the context of SEO, and how does Python facilitate it?
Data blending involves combining and analyzing diverse datasets to derive meaningful insights for SEO. Python, with its data manipulation libraries like Pandas, provides a powerful environment for blending and analyzing SEO-related data.
Which Python libraries are commonly used for data blending in SEO?
Pandas is a widely used Python library for data manipulation and blending. It allows beginners to merge, join, and analyze datasets, making it an essential tool for SEO professionals working with diverse data sources.
What specific SEO data can be blended using Python, and why is it beneficial?
Python enables the blending of various SEO data, including keyword rankings, website traffic, backlink profiles, and social media metrics. Combining these datasets can provide a holistic view, helping SEO practitioners make informed decisions and optimizations.
Are there any considerations for beginners when starting with SEO data blending using Python?
Beginners should focus on understanding basic Python syntax and Pandas functionality. Learning how to import, clean, and merge datasets is essential. Additionally, familiarity with different SEO data sources and formats will enhance the blending process.
Where can beginners find resources to learn SEO data blending with Python?
Online tutorials, introductory courses on Python and Pandas, and SEO-specific data blending guides are valuable resources for beginners. Explore these materials to build a foundational understanding of blending SEO data using Python.

- Evaluate Subreddit Posts in Bulk Using GPT4 Prompting - December 12, 2024
- Calculate Similarity Between Article Elements Using spaCy - November 13, 2024
- Audit URLs for SEO Using ahrefs Backlink API Data - November 11, 2024