Causal Impact is a Bayesian-like statistical algorithm pioneered by Kay Brodersen working at Google that aims to predict the counterfactual after an event. Take for example you make a large SEO change to a website. Sometimes it’s not obvious whether or not the change was beneficial. You can compare against the past, but the past is the past. What if you could train a model to predict the metric outcome alongside what actually happened. You could then measure the difference! Bingo! The difference is the causal impact.
An obvious observation might be, why wouldn’t you just run an experiment. You could and maybe should, but there are many instances where an experiment may not be possible or perhaps you just forgot or don’t have the time. This method may allow you to give statistical weight to your changes or perhaps the counter.
Causual Impact has deep roots in Causal inference, machine learning, and other statistical topics that are well beyond my grasp so I won’t even try to explain the methods used by the algorithm. Quite frankly it’s a bit of magic to me. The 10k foot view is that you train a model based on a set of time-series data that has one or more control groups. A control group will be a set of relevant data that wouldn’t have been affected by the change (in this script’s case, we’re using historical data as the control). You could even use weather or stock market data if relevant. You set the pre-period range and the post-period range and then using some statistical magic the algorithm predicts the outcome if the change hadn’t occurred.
I strongly suggest reading some of the support material below first to grasp a better understanding of how this all works so you can be more confident looking at the result data. The script is dead simple. The challenge is understanding the results and setting up the data for confidence in those results. Let’s start!
Table of Contents
Intro Resources
- Inferring the effect of an event using CausalImpact by Kay Brodersen (this guy developed the module!)
- Measuring SEO effectiveness using Causal Impact Analysis
- Estimate the Causal Effect Intervention on Time Series with causalimpact
- Causal Inference : An Introduction
Two possible modules, the first is what we use in this tutorial and app, but the second is a bit newer and uses TensorFlow Probability on top of the Causal Impact algorithm. Try it out and let me know how it goes!
Requirements and Assumptions
- Python 3 is installed and basic Python syntax understood
- Access to a Linux installation (I recommend Ubuntu) or Google Colab.
- Google Search Console ‘Date’ CSV of your site
Import and Install Modules
- pandas: for importing the GSC CSV file
- causalimpact: handles all the model work and output
First, we need to install causalimpact, from your terminal or Google Colab (include an exclamation mark)
pip3 install pycausalimpact
Now let’s import the two required modules into our script.
import pandas as pd
from causalimpact import CausalImpact
Time to import that Date CSV file from Google Search Console. When you export GSC performance data, you’ll download a zip file. Dates CSV file is in it.
- usecols: select the first two columns which happen to be date and clicks.
- header: CSV does not contain a header row
- encoding: BOM(Byte order mark)
- index_col: date column to be used as the index
data = pd.read_csv('Dates.csv',
                 usecols=[0,1],
                 header=0,
                 encoding="utf-8-sig",
                 index_col='Date')
Next, we specify our pre-period and post-period ranges. The time before and after changes have been made. You’ll want both ranges to be equidistant. Note that the success of the prediction sometimes rests on the length of the ranges. Sometimes a shorter range works better, sometimes a longer range. You’ll have to do a little trial and error. The ranges obviously have to exist within the data you upload.
pre_period = ["2020-07-07", "2020-07-13"]  # dates prior to change
post_period = ["2020-07-14", "2020-07-21"] # dates after change
Now we feed the main CausalImpact() function with our click data and the two ranges. This does all the heavy lifting. Easy!
If you want to add an element of seasonality to the model you can add the attribute nseasons=[{‘period’: X}] after post_period where X is a number of days. If you have week-day seasonality you could choose the number 7.
ci = CausalImpact(data['Clicks'], pre_period, post_period)
Depending on your data size it can take several seconds to a few minutes to process. Once done all is left is to print out the results.
- summary(): Returns the numerical results in a table form
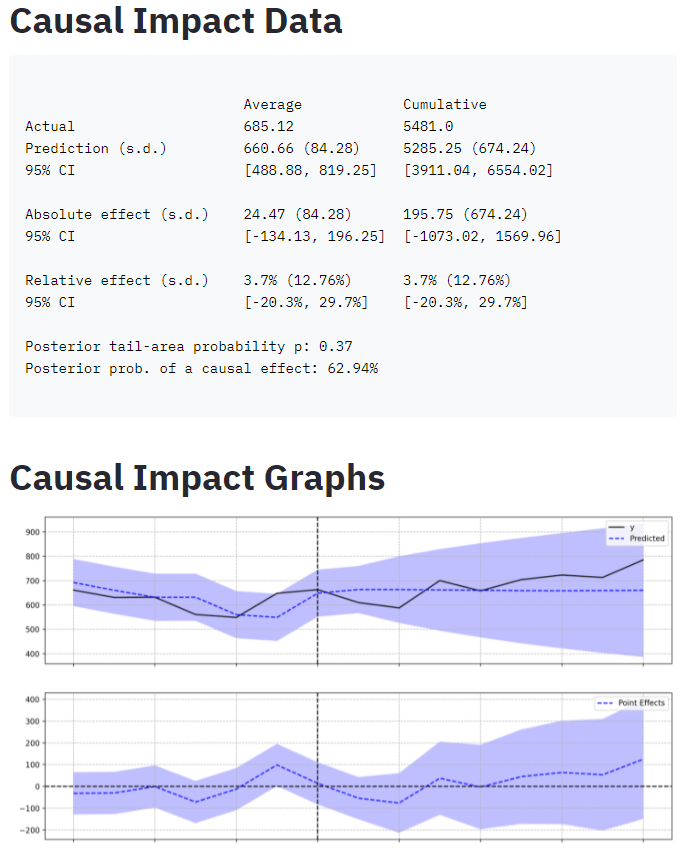
- plot(): Returns the 3 graphs
- Predicted: Shows the actual data alongside the predicted outcome from the model
- PointWise: This shows the difference
- Cumulative: This shows the summation of difference over time
- summary(output=’report’): Prints out a human-readable summary in paragraph form.
print(ci.summary())
ci.plot()
print(ci.summary(output='report'))
Translating the Results
It’s important to understand the algorithm creates many models and stores the results as a distribution. The following data is the analysis of that distribution result.
Average: The average metric calculated from all the created models
Cumulative: The summation of all data points for the models
Actual: The average after-event data (per day) that was provided showing the actual result
Prediction (s.d.): The mean result data generated by the models. Data if change never happened.
95% CI (confidence interval): 95% of the models returned a result within this range. The lowest data result from all models and the highest. The prediction will end up being the mean.
Absolute effect (s.d.): The difference between the actual and the prediction.
95% CI: 95% of the models returned a difference within this range.
Relative effect (s.d.): This will be the percent difference
95% CI: 95% of the models returned a percent difference within this range.
Posterior tail-area probability p: Likelihood of the result being the result of random fluctuations. Lower the better.
Posterior prob. of a causal effect: The probability the result is due to a causal effect. Higher the better.
Conclusion
Now get out there and try it out! Follow me on Twitter and let me know your applications and ideas!
>> Use the Causal Impact App! <<
Acknowledgments
“CausalImpact 1.2.7, Brodersen et al., Annals of Applied Statistics (2015). https://google.github.io/CausalImpact/”
Andrea Volpini – WordLift CEO, for his code insight and concept guidance!
Causal Impact for SEO FAQ
How can Python be used to measure causal impact from Google Search Console (GSC) data?
Python scripts can be developed to analyze GSC data and implement causal impact analysis techniques, helping identify the impact of specific events or changes on website performance.
Which Python libraries are commonly used for measuring causal impact with GSC data?
Libraries such as pandas for data manipulation, statsmodels for statistical analysis, and other data science tools are commonly used in Python for implementing causal impact analysis from GSC data.
What specific steps are involved in using Python to measure causal impact from GSC data?
The process includes fetching and preprocessing GSC data, applying statistical models to assess causal impact, and interpreting the results to understand how specific events or changes affect website performance.
Are there any considerations or limitations when using Python for causal impact analysis with GSC data?
Consider the accuracy of statistical models, potential confounding factors, and the need for careful interpretation of results. Human expertise may be required to validate and refine the analysis.
Where can I find examples and documentation for measuring causal impact with GSC data using Python?
Explore online tutorials, documentation for statistical analysis libraries like statsmodels, and resources specific to Python for SEO analysis for practical examples and detailed guides on measuring causal impact from GSC data.

- Storing CrUX CWV Data for URLs Using Python for SEOs - January 20, 2024
- Scraping YouTube Video Page Metadata with Python for SEO - January 4, 2024
- Calculate SERP Rank Readability Scores Using Python - August 20, 2023